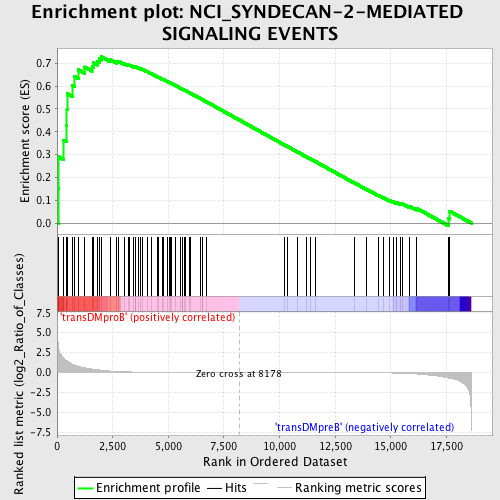
Profile of the Running ES Score & Positions of GeneSet Members on the Rank Ordered List
| Dataset | Set_04_transDMproB_versus_transDMpreB.phenotype_transDMproB_versus_transDMpreB.cls #transDMproB_versus_transDMpreB.phenotype_transDMproB_versus_transDMpreB.cls #transDMproB_versus_transDMpreB_repos |
| Phenotype | phenotype_transDMproB_versus_transDMpreB.cls#transDMproB_versus_transDMpreB_repos |
| Upregulated in class | transDMproB |
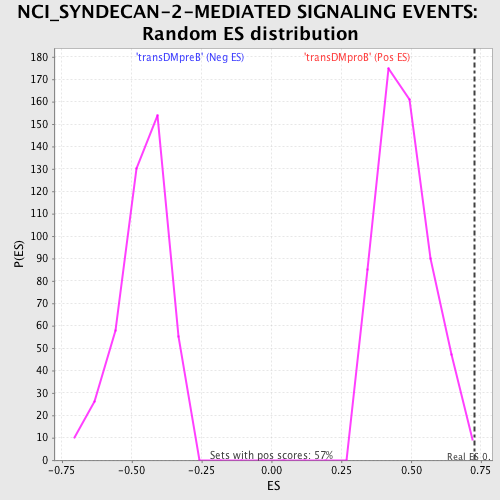
| GeneSet | NCI_SYNDECAN-2-MEDIATED SIGNALING EVENTS |
| Enrichment Score (ES) | 0.72817916 |
| Normalized Enrichment Score (NES) | 1.5299679 |
| Nominal p-value | 0.0035273368 |
| FDR q-value | 0.36507592 |
| FWER p-Value | 0.874 |
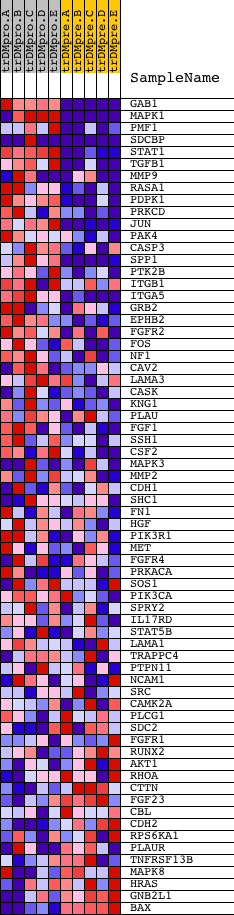
| PROBE | DESCRIPTION (from dataset) | GENE SYMBOL | GENE_TITLE | RANK IN GENE LIST | RANK METRIC SCORE | RUNNING ES | CORE ENRICHMENT | |
|---|---|---|---|---|---|---|---|---|
| 1 | GAB1 | 18828 | 58 | 3.226 | 0.1515 | Yes | ||
| 2 | MAPK1 | 1642 11167 | 80 | 2.911 | 0.2899 | Yes | ||
| 3 | PMF1 | 12452 | 296 | 1.747 | 0.3620 | Yes | ||
| 4 | SDCBP | 2339 6998 6999 | 414 | 1.526 | 0.4288 | Yes | ||
| 5 | STAT1 | 3936 5524 | 443 | 1.477 | 0.4981 | Yes | ||
| 6 | TGFB1 | 18332 | 452 | 1.452 | 0.5672 | Yes | ||
| 7 | MMP9 | 14732 | 696 | 1.021 | 0.6031 | Yes | ||
| 8 | RASA1 | 10174 | 782 | 0.936 | 0.6433 | Yes | ||
| 9 | PDPK1 | 23097 | 950 | 0.777 | 0.6716 | Yes | ||
| 10 | PRKCD | 21897 | 1237 | 0.576 | 0.6838 | Yes | ||
| 11 | JUN | 15832 | 1569 | 0.428 | 0.6864 | Yes | ||
| 12 | PAK4 | 17909 | 1643 | 0.400 | 0.7017 | Yes | ||
| 13 | CASP3 | 8693 | 1817 | 0.337 | 0.7085 | Yes | ||
| 14 | SPP1 | 5501 | 1889 | 0.315 | 0.7198 | Yes | ||
| 15 | PTK2B | 21776 | 1990 | 0.287 | 0.7282 | Yes | ||
| 16 | ITGB1 | 3872 18411 | 2396 | 0.181 | 0.7150 | No | ||
| 17 | ITGA5 | 22105 | 2663 | 0.136 | 0.7072 | No | ||
| 18 | GRB2 | 20149 | 2736 | 0.123 | 0.7092 | No | ||
| 19 | EPHB2 | 4675 2440 8910 | 3035 | 0.087 | 0.6973 | No | ||
| 20 | FGFR2 | 1917 4722 1119 | 3186 | 0.073 | 0.6927 | No | ||
| 21 | FOS | 21202 | 3267 | 0.066 | 0.6916 | No | ||
| 22 | NF1 | 5165 | 3443 | 0.054 | 0.6847 | No | ||
| 23 | CAV2 | 8699 1064 | 3508 | 0.049 | 0.6836 | No | ||
| 24 | LAMA3 | 23620 2009 | 3524 | 0.048 | 0.6851 | No | ||
| 25 | CASK | 24184 2618 2604 | 3659 | 0.041 | 0.6799 | No | ||
| 26 | KNG1 | 9244 22809 | 3757 | 0.037 | 0.6764 | No | ||
| 27 | PLAU | 22084 | 3853 | 0.034 | 0.6729 | No | ||
| 28 | FGF1 | 1994 23447 | 4054 | 0.027 | 0.6635 | No | ||
| 29 | SSH1 | 10540 | 4222 | 0.023 | 0.6556 | No | ||
| 30 | CSF2 | 20454 | 4516 | 0.017 | 0.6406 | No | ||
| 31 | MAPK3 | 6458 11170 | 4552 | 0.016 | 0.6395 | No | ||
| 32 | MMP2 | 18525 | 4746 | 0.014 | 0.6297 | No | ||
| 33 | CDH1 | 18479 | 4770 | 0.014 | 0.6292 | No | ||
| 34 | SHC1 | 9813 9812 5430 | 4950 | 0.012 | 0.6201 | No | ||
| 35 | FN1 | 4091 4094 971 13929 | 5066 | 0.011 | 0.6144 | No | ||
| 36 | HGF | 16916 | 5075 | 0.011 | 0.6145 | No | ||
| 37 | PIK3R1 | 3170 | 5127 | 0.011 | 0.6123 | No | ||
| 38 | MET | 17520 | 5337 | 0.010 | 0.6015 | No | ||
| 39 | FGFR4 | 3226 | 5546 | 0.008 | 0.5907 | No | ||
| 40 | PRKACA | 18549 3844 | 5640 | 0.008 | 0.5860 | No | ||
| 41 | SOS1 | 5476 | 5657 | 0.008 | 0.5855 | No | ||
| 42 | PIK3CA | 9562 | 5742 | 0.007 | 0.5814 | No | ||
| 43 | SPRY2 | 21725 | 5759 | 0.007 | 0.5809 | No | ||
| 44 | IL17RD | 22069 | 5936 | 0.007 | 0.5717 | No | ||
| 45 | STAT5B | 20222 | 5994 | 0.006 | 0.5689 | No | ||
| 46 | LAMA1 | 23168 | 6455 | 0.005 | 0.5443 | No | ||
| 47 | TRAPPC4 | 19147 | 6517 | 0.004 | 0.5413 | No | ||
| 48 | PTPN11 | 5326 16391 9660 | 6520 | 0.004 | 0.5414 | No | ||
| 49 | NCAM1 | 5149 | 6694 | 0.004 | 0.5322 | No | ||
| 50 | SRC | 5507 | 10223 | -0.005 | 0.3423 | No | ||
| 51 | CAMK2A | 2024 23541 1980 | 10341 | -0.005 | 0.3362 | No | ||
| 52 | PLCG1 | 14753 | 10822 | -0.007 | 0.3106 | No | ||
| 53 | SDC2 | 9134 | 11210 | -0.008 | 0.2901 | No | ||
| 54 | FGFR1 | 3789 8968 | 11379 | -0.008 | 0.2815 | No | ||
| 55 | RUNX2 | 4480 8700 | 11607 | -0.009 | 0.2697 | No | ||
| 56 | AKT1 | 8568 | 13355 | -0.021 | 0.1765 | No | ||
| 57 | RHOA | 8624 4409 4410 | 13910 | -0.029 | 0.1480 | No | ||
| 58 | CTTN | 8817 4575 1035 8818 | 14438 | -0.040 | 0.1215 | No | ||
| 59 | FGF23 | 17275 | 14683 | -0.047 | 0.1107 | No | ||
| 60 | CBL | 19154 | 14950 | -0.058 | 0.0991 | No | ||
| 61 | CDH2 | 1963 8727 8726 4508 | 15118 | -0.068 | 0.0933 | No | ||
| 62 | RPS6KA1 | 15725 | 15263 | -0.077 | 0.0893 | No | ||
| 63 | PLAUR | 18351 | 15433 | -0.089 | 0.0844 | No | ||
| 64 | TNFRSF13B | 7181 | 15525 | -0.096 | 0.0841 | No | ||
| 65 | MAPK8 | 6459 | 15826 | -0.132 | 0.0742 | No | ||
| 66 | HRAS | 4868 | 16140 | -0.184 | 0.0662 | No | ||
| 67 | GNB2L1 | 20911 | 17600 | -0.690 | 0.0206 | No | ||
| 68 | BAX | 17832 | 17651 | -0.712 | 0.0520 | No |